Academic Writing Task 1 asks you to look at a chart, graph, table or diagram and describe it in at least 150 words in about 20 minutes. Many students lose marks here not because their English is weak, but because they do not know what the examiner wants to see. This guide gives you a simple four-step method that works for line graphs, bar charts, pie charts and tables, followed by a model answer you can study.
Let’s be honest: Task 1 feels a little strange the first time. There is no opinion to share and no essay to build, just a picture full of numbers. The good news is that it is the most predictable task in the whole test, and a simple routine fixes most problems.
If you want to practise while you read, you can try a timed question on our IELTS Academic Writing Task 1 practice page and get AI feedback on your answer.
What Task 1 actually tests
Your answer is marked on four things:
- Task Achievement: did you describe the key features and include a clear overview?
- Coherence and Cohesion: is your answer organised in logical paragraphs with clear linking?
- Lexical Resource: do you use a range of accurate vocabulary for trends and comparisons?
- Grammatical Range and Accuracy: do you use a mix of sentence structures with few errors?
Notice what is not on the list: your opinion. Task 1 is about reporting information, not explaining reasons or giving your view. Never write why something happened unless the chart itself tells you.
On the computer-based test you type your answer, so you can see a word counter. Aim for 170 to 190 words. Writing less than 150 words can lower your Task Achievement score, and writing 250 words usually means you are describing too much detail and running out of time.
The 4-step plan (20 minutes)
- Read the chart carefully (2 to 3 minutes)
- Write the introduction (1 to 2 minutes)
- Write the overview (2 minutes)
- Write two body paragraphs (10 to 12 minutes), then check (2 minutes)
Step 1: Read the chart carefully
Before you write anything, answer these five questions in your head or on your notes:
- What is the topic? (read the title and the question sentence)
- What are the units? (percentages, millions, dollars, tonnes, hours?)
- What is the time period, or is it a single point in time?
- What are the main categories being compared?
- What is the biggest change, the highest value, the lowest value?
Spending two minutes here saves you from the most common error: describing numbers without understanding what they mean.
Step 2: Write the introduction
The introduction is one sentence. Paraphrase the question; do not copy it. Change the verb, the noun phrases and the word order.
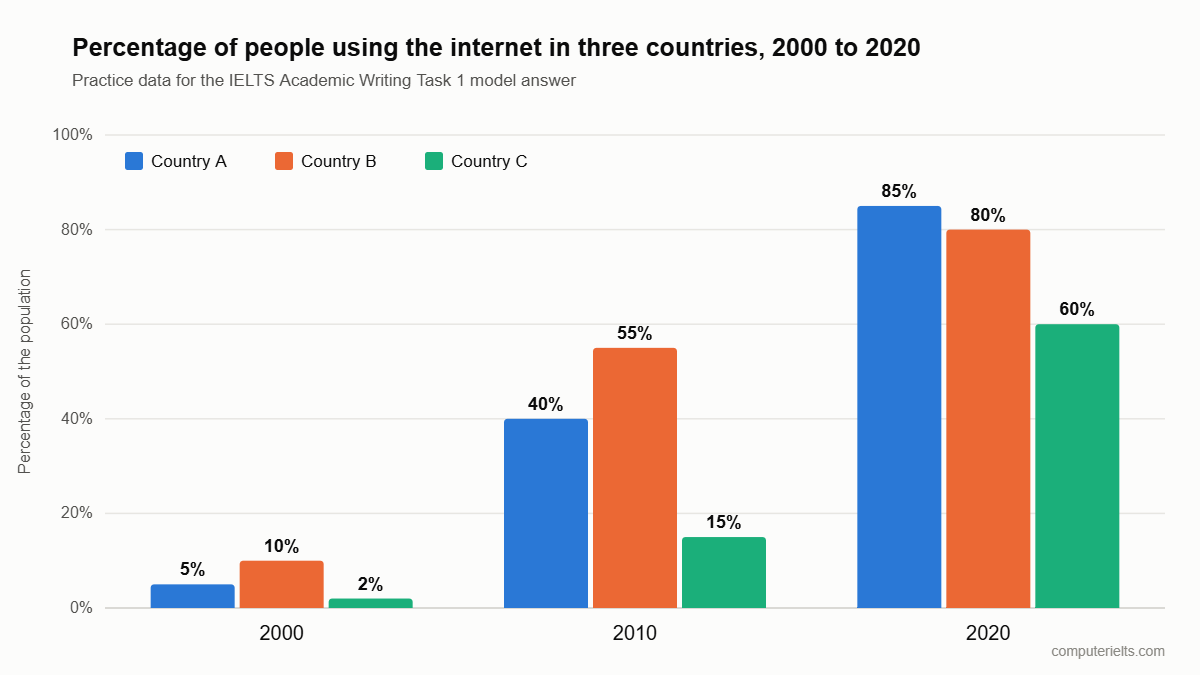
Question: The chart shows the percentage of people using the internet in three countries between 2000 and 2020.
Paraphrase: The bar chart compares the proportion of the population who went online in Country A, Country B and Country C in 2000, 2010 and 2020.
Useful swaps:
- shows / illustrates / compares / gives information about
- percentage / proportion / share / figure
- people using / the number of users / those who used
Do not add numbers or opinions to the introduction.
Step 3: Write the overview
The overview is the most important paragraph for your score, and it is where many students are weakest. An overview does not contain detailed numbers. It gives the two or three biggest points a reader should take away.
Ask yourself:
- What is the main trend (rise, fall, stable, fluctuating)?
- Which category is highest or lowest overall, or what changed rank?
- Is there one clear contrast?
Example: Overall, internet use rose sharply in all three countries over the period, and Country A overtook Country B to become the highest by 2020, while Country C remained the lowest throughout.
Start with “Overall,” or “In general,”. Put the overview straight after the introduction, as its own short paragraph, so the examiner cannot miss it.
A simple way to think about it: if a friend asked you, “So, what does this chart say?”, what would you answer in two sentences? That answer is your overview.
Step 4: Write the body paragraphs
You usually need two body paragraphs. The key skill is grouping, not listing. Do not describe every number in order. Group data that belongs together:
- by time (the early period, then the later period), or
- by category (the high group, then the low group), or
- by trend (the items that rose, then the items that fell).
Choose three to five key numbers per paragraph and make comparisons between them. Use figures accurately: say “about 40%” or “just over 40%” if you are not sure of the exact value, but never invent data that is not on the chart.
Do not try to sound clever here. Clear and correct is better than fancy and risky, every single time.
Useful language
Describing trends
- rose / increased / climbed / grew
- fell / dropped / declined / decreased
- remained stable / stayed constant / levelled off
- fluctuated / varied
- peaked at / reached a high of / hit a low of
Describing the size of change
- a sharp / dramatic / significant rise
- a steady / gradual / slight increase
- more than doubled / tripled / rose fourfold
- by far the highest / the lowest figure
Comparing
- X was higher than Y / X exceeded Y
- X was twice as high as Y
- In contrast, / Whereas / While
- X overtook Y / X surpassed Y
Approximating
- just under / just over / roughly / approximately / around / nearly
Model answer
Here is an example chart question with made-up data, written only for practice. Imagine a bar chart showing the percentage of people using the internet:
- Country A: 5% in 2000, 40% in 2010, 85% in 2020
- Country B: 10% in 2000, 55% in 2010, 80% in 2020
- Country C: 2% in 2000, 15% in 2010, 60% in 2020
You should spend 20 minutes on this task. Write at least 150 words.
Model answer:
The bar chart compares the proportion of the population who used the internet in Country A, Country B and Country C in 2000, 2010 and 2020.
Overall, internet use rose sharply in all three countries over the period. Country A overtook Country B to become the highest by 2020, while Country C remained the lowest throughout.
In 2000, internet use was low everywhere. Country B led with 10%, followed by Country A at 5%, and only 2% of people in Country C were online. By 2010, the figures had climbed considerably, to 55% in Country B, 40% in Country A and 15% in Country C, although Country C was still far behind.
The most dramatic change took place between 2010 and 2020. Country A more than doubled its figure, from 40% to 85%, and so moved ahead of Country B, which grew more slowly, from 55% to 80%. Country C’s usage rose fourfold, from 15% to 60%, which narrowed the gap with the other two countries, although it stayed the lowest.
(About 170 words)
Read the model answer once to get ideas, then close it and try the same chart yourself. Copying phrases word for word will not help you on exam day, but using the same method will.
Why this answer works
- The introduction paraphrases the question and adds no opinion.
- The overview is separate, short and names the main trend and the key comparison.
- Body paragraph one covers the early period and body paragraph two covers the later period, so the data is grouped, not listed.
- Every number matches the chart, and comparison words (led, overtook, narrowed the gap) show range.
- It contains no reasons or opinions.
Six common mistakes
- No overview. This is the biggest mistake. Without one, Task Achievement is capped at a low band.
- Copying the question word for word in the introduction.
- Describing every single number. The examiner wants key features, not a data dump.
- Giving reasons (“because people bought more phones”). Report only what the chart shows.
- Using the wrong tense. Use the past simple for past dates, and the future with “will” or “is expected to” only for projections.
- Mixing up units, for example writing “millions” when the chart shows percentages.
How to practise for the computer-based test
- Practise typing your answer with a timer set to 20 minutes.
- Check your word count at the end, then read your answer once for spelling and tense.
- Do the same chart twice: the first time as an exam, the second time reading the examiner-style feedback and rewriting weak sentences.
- If you write on paper at home, you can upload a photo to our handwritten writing evaluation to get a band score and feedback.
- After Task 1, practise Task 2. See our guide to IELTS Writing Task 2 templates and our Band 9 tips.
One last tip for the final five minutes: stop adding new details and read your answer once for tenses and numbers. A wrong number hurts more than a missing one.
Frequently asked questions
How many words should I write in IELTS Academic Task 1?
At least 150 words. Most strong answers are 170 to 190 words. There is no benefit in writing much more.
How long should I spend on Task 1?
About 20 minutes. Task 2 is worth more marks, so spend the remaining 40 minutes on it.
Do I need to describe every number on the chart?
No. Select the key features and make comparisons. Group the data instead of listing it.
What if the chart has two or more different charts (a mixed chart)?
Write one overview that covers both, then use one body paragraph per chart, and mention any link between them.
Should I give my opinion in Task 1?
No. Task 1 is a factual report. Opinions and reasons belong in Task 2.
Is the Task 1 chart different on the computer-based IELTS?
The task types are the same, but you type the answer and see a word counter. Practising on a computer, as you can on this site, helps you get used to it.
Next step: try a timed Task 1 question on our IELTS Academic Writing Task 1 practice page and compare your answer with the model above.
Task 1 is a skill, not a talent. A little practice every day makes it feel much easier, so start with one chart today.